How Junjo AI Studio handles growing telemetry
Start with a compact deployment. Size Junjo AI Studio around the telemetry you send, the history you retain, and the investigations your coding agents and team run. This page explains the data pipeline, recorded throughput under explicit resource limits, and the deployment boundaries that matter as usage grows.
One deployment. Separate responsibilities.
Section titled “One deployment. Separate responsibilities.”The minimal distribution runs the three Studio services using production images. “Minimal” describes the setup: it includes the Studio backend, ingestion service, and web UI, rather than a reduced analytics engine. Your application can run alongside Studio or on other machines.
| Component | Responsibility |
|---|---|
| Rust ingestion service | Receive OTLP traces, batch spans into a write-ahead log, and produce Parquet files. |
| Backend API | Store accounts and evaluation records, index telemetry files, and answer evidence queries from coding agents and the web UI. |
| Web UI | Let people inspect datasets, evaluation runs, traces, and recorded state changes. |
Your application runs the model calls, tools, workflows, and evaluator judges. Those compute costs are separate from Studio’s resource requirements. Your coding agent runs the development cycle; Studio provides its shared experiment data and execution evidence.
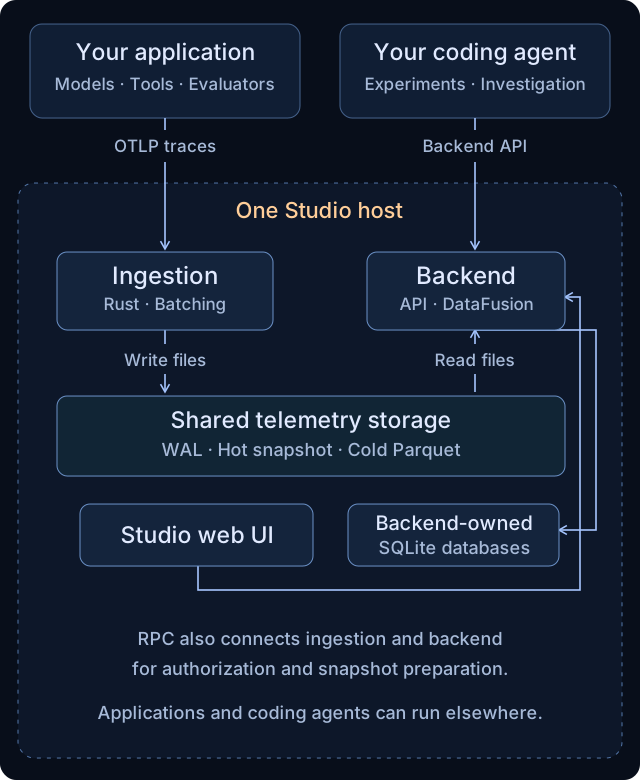
How telemetry moves through Studio
Section titled “How telemetry moves through Studio”- Receive and batch. The Rust service authenticates OTLP exports and collects spans into batches. Completed batches become Arrow IPC WAL segments.
- Store execution history. The flusher reads segments and writes compressed, date-partitioned Parquet files. It processes segments sequentially instead of loading the entire retained history into memory.
- Select relevant files. A SQLite metadata index tracks file and trace information. It narrows which files the backend needs to examine for a query; full span payloads remain in Parquet.
- Query recent and stored evidence. DataFusion reads selected Parquet files alongside an ingestion-generated snapshot of recent data. The query path also includes newly flushed files awaiting indexing, closing the visibility gap.
This separates stored data volume from the amount of data required for an individual operation. It does not make every operation constant-memory: payload size, file size, distinct traces, selected files, and concurrent queries still affect resource use. DataFusion supports configurable parallelism, Parquet pruning, and disk spill for query workloads.
The Docker reference owns the storage paths and mount configuration. Preserve both canonical evaluation records and telemetry files when moving the deployment.
Throughput and resources
Section titled “Throughput and resources”The following September 7, 2026 measurements use the same resource allocation.
They report absolute results for the tested implementation, including the
metadata reader in commit
f260375.
Resource allocation
Section titled “Resource allocation”| Service | CPU quota | Container memory limit |
|---|---|---|
| Ingestion | 0.5 CPU | 350 MiB |
| Backend, including indexing and queries | 0.5 CPU | 450 MiB |
| Combined | 1 CPU | 800 MiB |
Swap was disabled. The host was Apple Silicon macOS running Docker, with unrelated workloads present. These are container quotas, not a dedicated one-core physical machine. The load generator ran outside these limits; the web UI, host OS, application, and model inference were not included.
Ingestion and completed indexing
Section titled “Ingestion and completed indexing”| Recorded workload | Spans acknowledged per second | Spans persisted and indexed | Time through completed indexing |
|---|---|---|---|
| Paced ingestion with two concurrent query workers | 16,023 | 960,000 | 65.8 s |
| Unpaced ingestion without concurrent queries | 145,665 | 1,280,000 | 66.5 s |
The first row is one longer mixed-workload run: 50 exporters each sent 600 exports, with 32 spans per export and a 100 ms start-to-start cadence. Ingestion ran for 59.9 seconds. The backend served 1,569 successful queries through completed indexing. The second row is one unpaced run, with 1.28 million spans and no concurrent query workload.
Acknowledged spans/sec measures ingestion during export traffic. It is different from throughput through completed indexing. Both runs include a final benchmark-triggered WAL flush and time for the normal indexer to catch up. Most indexing in the unpaced run occurs after exports finish. For the mixed run, dividing 960,000 spans by the measured 65.7979 seconds gives approximately 14,590 spans/sec through completed indexing.
Latency and observed memory
Section titled “Latency and observed memory”| Measurement | Mixed workload | Unpaced workload |
|---|---|---|
| Export p95 latency | 4.62 ms | 55.95 ms |
| Query p95 through completed indexing | 57.09 ms | No query workload |
| Peak sampled backend working set | 350.8 MiB | 319.7 MiB |
The memory values are sampled container working sets, not total host RAM or precise process RSS. They do not replace the configured memory limits above; cgroup memory also includes resources such as page cache.
Both runs verified all offered spans in canonical storage, with no missing
acknowledged spans or duplicates, and completed without OOM kills or container
restarts. The mixed run included 36 retryable UNAVAILABLE attempts; all 30,000
logical exports ultimately succeeded. Generated or queued spans are not counted
as delivered work.
These short synthetic workloads establish measured results for this allocation. They do not establish sustained capacity over months of retained history, large LLM payloads, or a distributed deployment. The paced rate is limited by offered traffic. Larger CPU/RAM configurations need their own measurements; throughput should not be extrapolated linearly from these results.
Tested build and release: these measurements use a source-verified benchmark
build recorded on September 7, 2026. The Studio 0.83.0 production images
referenced by the distribution at that time predate this implementation. These
are tested-build results, not a benchmark of those 0.83.0 images. Check the
release notes and image versions when reproducing them.
The immutable measurement record and methodology contains all workloads and their disposition. The mixed-run JSON, unpaced-run JSON, and provenance record delivery checks, source and image identities, constraints, and observations.
Start small, then size for your workload
Section titled “Start small, then size for your workload”The distribution’s setup offers 1 GB, 2 GB, and 4 GB VM profiles. These configure backend memory and query resources; they are deployment settings, not benchmarked throughput tiers or a maximum supported machine size. Use the profile in your selected release, then measure the workload on the actual host.
| Workload dimension | What to measure | Resource implications |
|---|---|---|
| Incoming telemetry | Delivered spans/sec, bytes/sec, export latency, and retries | CPU, network, and disk write performance |
| AI payload size | Prompt, response, tool-result, and state-diff bytes per span | Batch memory, file size, storage growth, and read cost |
| Retained history | Disk usage, file count, distinct traces, and representative query latency | Persistent storage, metadata index size, and selected-file reads |
| Concurrent investigation | Active coding agents and users, query p95, and disk spill | Backend CPU, memory, and temporary disk capacity |
| Indexing catch-up | Time and outstanding files between cold-file creation and indexing | Indexer capacity relative to incoming traffic |
Size storage from observed bytes on disk per day and the history you intend to keep, allowing space for WAL files, snapshots, query spill, and backups. A count of spans alone is insufficient: a small timing span and a span containing a long model response can have very different sizes.
When moving to a larger host, review container limits and the query profile alongside CPU, RAM, and disk performance. Allocating more host RAM while keeping the original container limits does not give that memory to the backend.
Separating services across machines
Section titled “Separating services across machines”The supported Compose topology keeps backend and ingestion on a host with shared telemetry storage. Applications and coding agents can connect from other machines through the configured ingestion and backend endpoints.
Ingestion and backend have separate RPC addresses, but their contract also includes filesystem paths. The backend directly opens the hot snapshot and Parquet files created by ingestion. Moving the containers onto unrelated disks does not preserve that contract.
| Deployment change | Current status |
|---|---|
| Run applications and coding agents on other machines | Supported through reachable, authenticated service endpoints. |
| Increase resources on the Studio host | Supported through deployment configuration and workload-based sizing. |
| Move ingestion and backend onto separate machines | Requires a designed and validated shared-data topology; not a supported distribution today. |
| Add ingestion or backend replicas behind a load balancer | Requires explicit data ownership, coordination, and query routing; not established by the current Compose setup. |
| Replace local telemetry files with object storage | Requires a storage integration; not a drop-in setting in the current distribution. |
A multi-machine design would need to specify who owns each WAL and snapshot, how queries discover and read all relevant data, how metadata indexing is coordinated, and how private RPCs and backend-owned SQLite records are handled. Separate containers make responsibilities explicit; they do not by themselves provide distributed storage or high availability. This describes the current boundary rather than promising an unimplemented deployment option.
Operating a growing deployment
Section titled “Operating a growing deployment”- Watch ingestion and indexing together. Check final exporter outcomes, retries, ingestion pressure, indexing failures, and catch-up time. A quick acknowledgement does not establish that the complete workload is indexed.
- Measure queries during writes. Test the trace lookups, evaluation-run investigations, and service queries your agents actually perform while normal telemetry traffic continues.
- Track storage and memory. Monitor persistent-disk growth, free space, container limits, query spill, and resource pressure before choosing a larger profile or changing configuration.
- Back up the shared record. Preserve canonical evaluation/account databases, telemetry files, and deployment configuration with a consistent backup. Follow the selected release’s upgrade and migration instructions.
- Allow orderly shutdown. Partial batches can remain in memory after an OTLP success response. Abrupt termination can lose those pending spans. Orderly shutdown drains in-flight work and persists pending batches; completed WAL segments provide recovery data. This is not a host-power-loss guarantee.
For a capacity study, use representative payloads and retained history, run ingestion alongside queries, and record spans/sec, bytes/sec, latency, CPU, memory, indexing lag, retries, and verified persisted counts. Repeat on each resource profile you intend to deploy. The component benchmark tooling provides the starting point; keep tests isolated from production data.
Continue with deployment setup or the Docker configuration reference.