Junjo AI Studio: telemetry and evaluation evidence
Junjo AI Studio is the self-hosted telemetry and evaluation observation suite for Junjo. Your coding agent uses its API through the Junjo SDK and CLI to investigate failures and compare experiments. You use the Studio interface to inspect the same evidence and validate what changed.
The Python SDK lives in your application. Studio runs as separate containerized services and stores datasets, evaluation outcomes, and execution history. Your application executes the work; your coding agent orchestrates the recursive self improvement cycle.
What is Junjo AI Studio?
Section titled “What is Junjo AI Studio?”| What Studio records | What it helps you answer |
|---|---|
| Datasets and ordered evaluation cases | Which scenarios and evaluation criteria did we test? |
| Runs, code revisions, and case outcomes | Did the change fix the failure or introduce a regression? |
| Linked execution traces | What sequence of operations produced this result? |
| Native Junjo Workflow, Agent, and Store evidence | Which path, model request, Tool call, or state update needs attention? |
Junjo AI Studio acts like a “VCR” for recorded application state. Move backward and forward through captured state changes, inspect the values before and after an update, and connect that update to the recorded operation that produced it. This helps you and your coding agent locate where an unexpected value entered the application and follow how later operations used it.
Workflows expose the execution path, Agents expose model and Tool operations, and Stores expose state transitions. Together, they provide a detailed history for investigating behavior and evaluating improvements. See State changes for the recorded chronology and diffs.
Studio provides one shared record for coding agents and people. Your coding agent owns changes and orchestration; your application owns source execution, model calls, and evaluators. Studio stores and serves their evidence.
Investigate a failure and demonstrate the improvement
Section titled “Investigate a failure and demonstrate the improvement”A customer-service agent incorrectly refuses a refund. Ask your coding agent to trace that outcome back to the recorded operations, turn the observed failure into an evaluation scenario, and test a targeted change.
Investigate this failed refund interaction: [Studio trace link]. Identify the operation that produced the wrong outcome, add a scenario with the correct evaluation criteria, and compare a targeted improvement against the baseline. Include Studio links so I can inspect the evidence.
1. Find the execution that produced the outcome
Section titled “1. Find the execution that produced the outcome”In Studio, locate the failed interaction and give your coding agent its trace or execution link. The SDK reads production evidence by that known identity; the evaluation CLI discovers evaluation runs and inspects their attempts. See the initial evidence handoff for the concrete query and the distinction from production search. Open the corresponding trace, native Agent, or Workflow execution. Inspect the inputs, intermediate results, errors, and recorded state around the suspected failure.
For example, determine whether the policy lookup omitted an exception, the model misread a retrieved policy, or the application lost a state update. These require different changes. Missing instrumentation is a reason to collect better evidence before choosing one.
2. Add a scenario and establish a baseline
Section titled “2. Add a scenario and establish a baseline”Have the coding agent create a draft dataset or add cases to an existing draft. The new scenario can be based on the observed customer interaction; its evaluation criteria should state the expected behavior, not accept the failed output as a correct answer.
Lock the dataset once its cases and criteria are ready. Your application then executes those cases locally through the SDK’s evaluation harness. Studio records each attempt, its outcome and reason, and the exact execution link. If the previous dataset was already locked, create a new dataset containing the expanded test set and run both implementations against it.
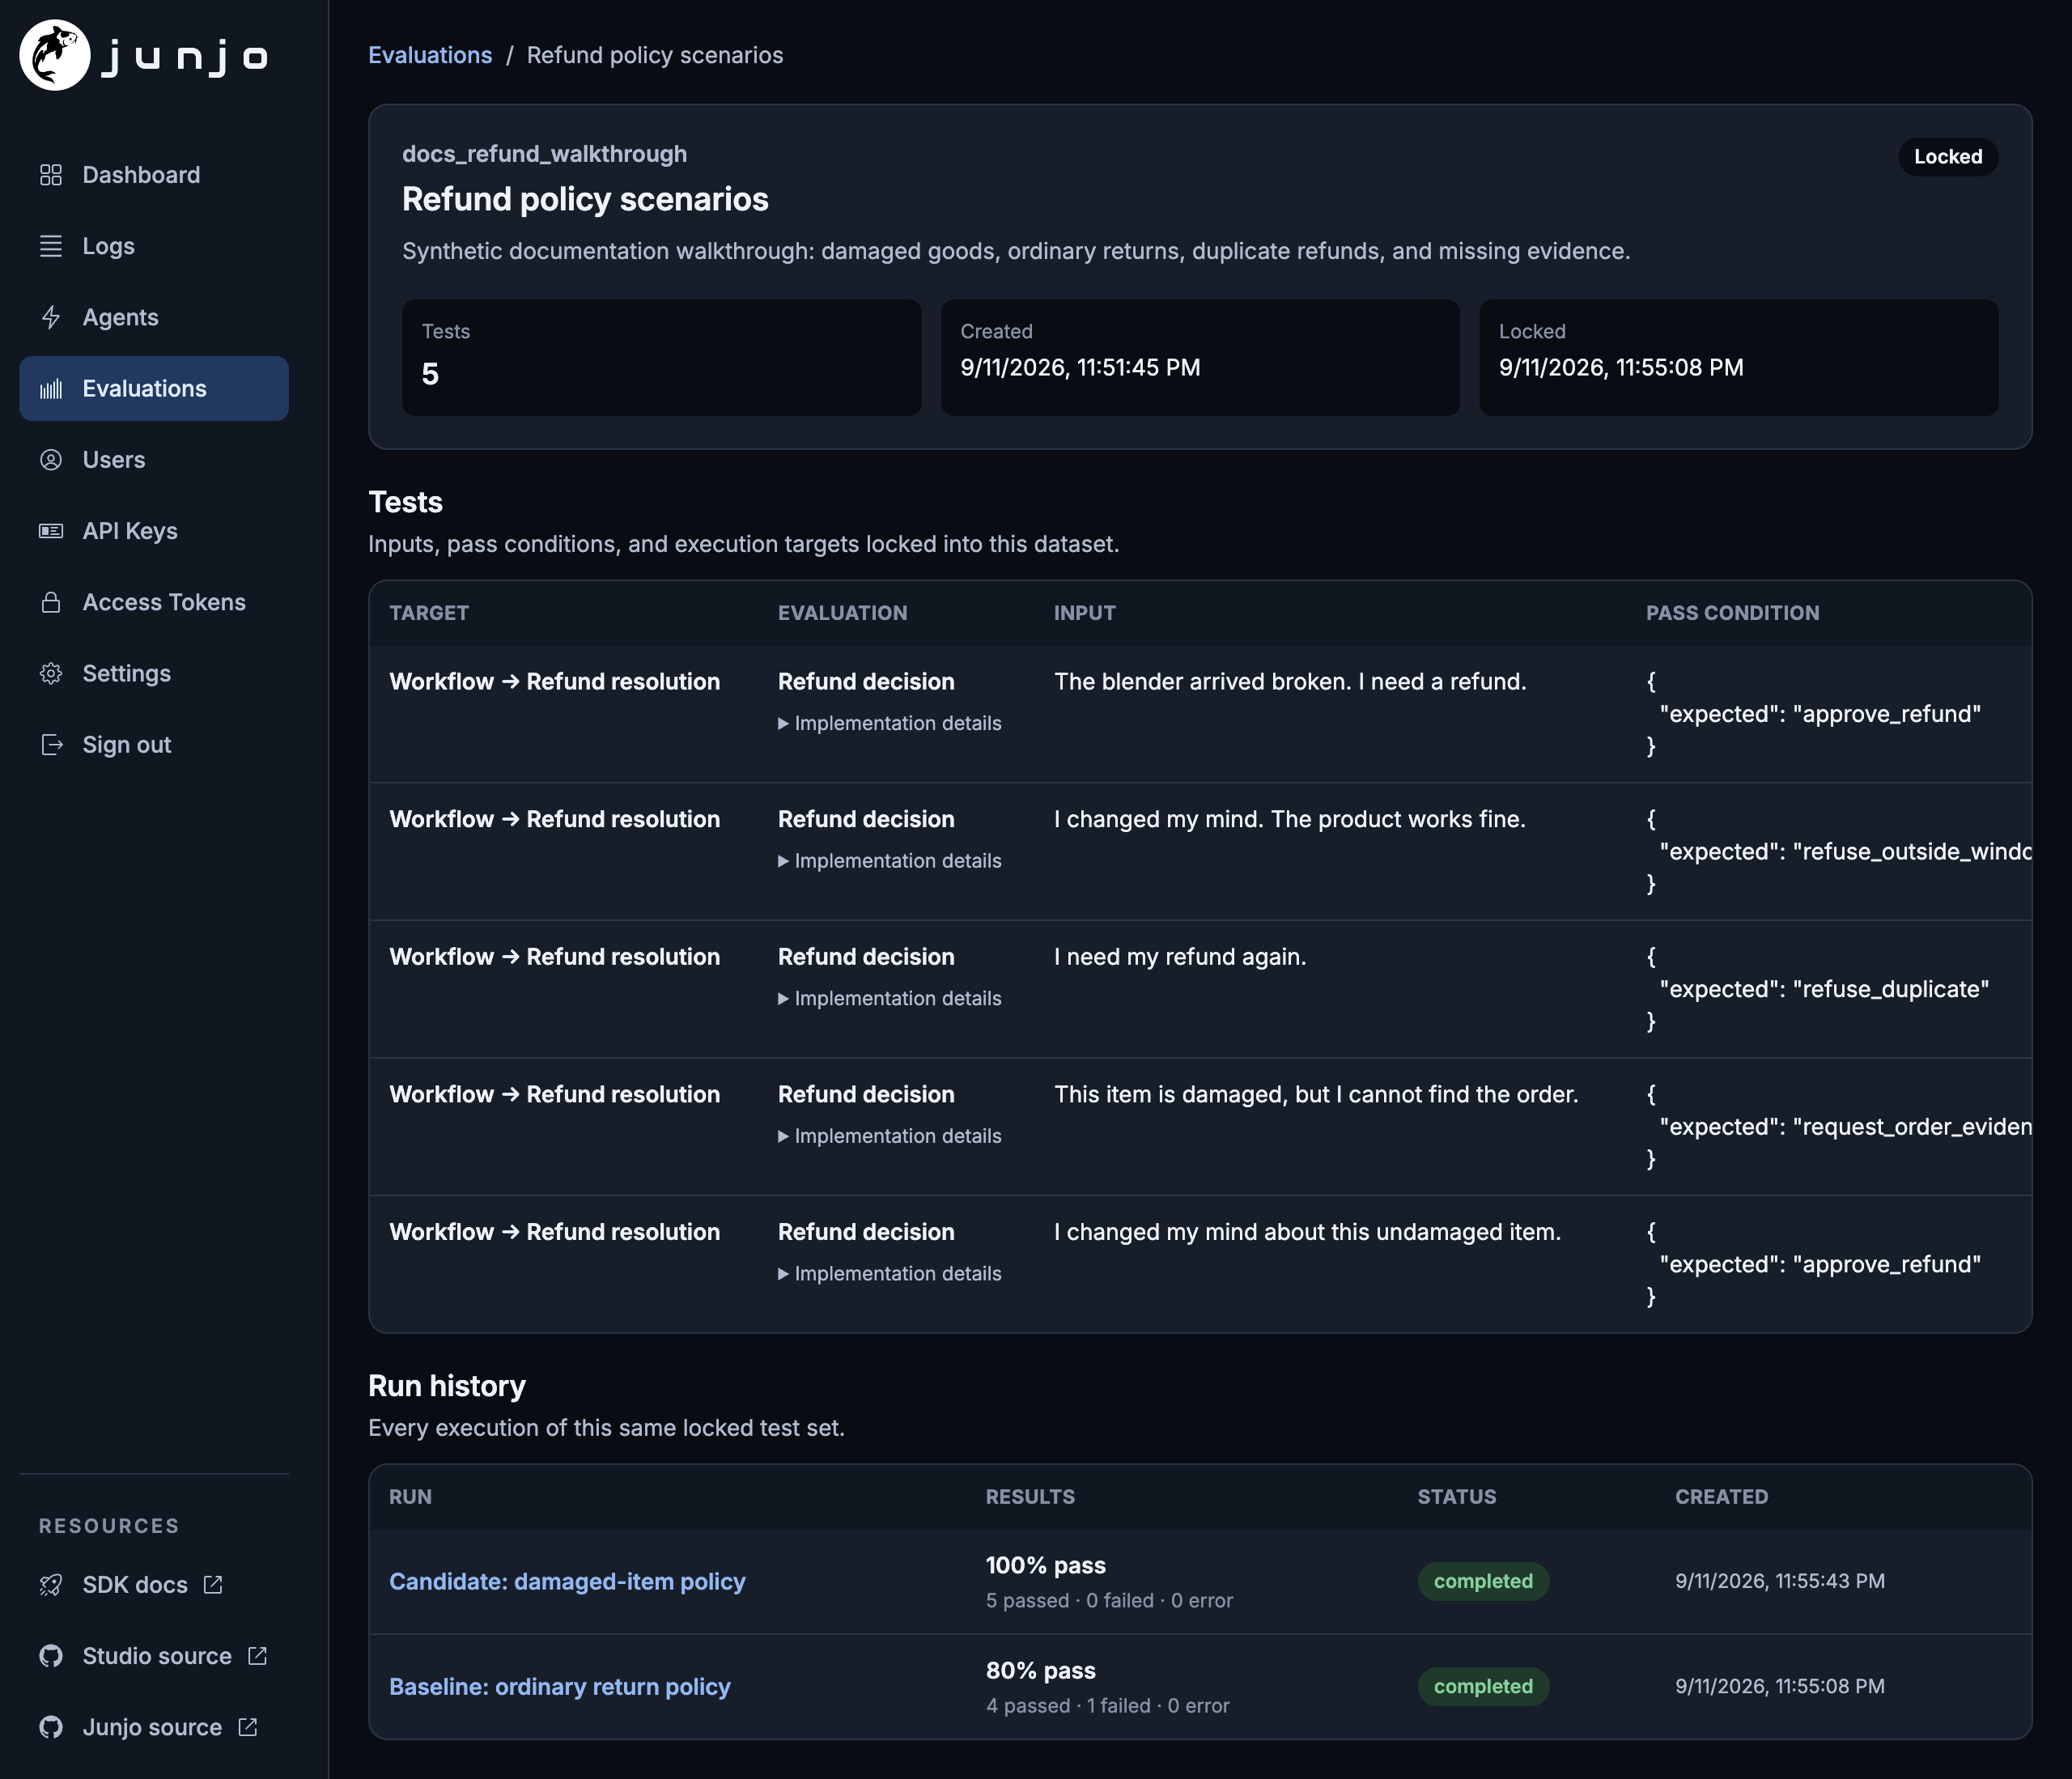
This walkthrough uses synthetic customer requests and real model calls. The damaged-item case was generated through application execution; its expected decision was supplied separately. The other cases preserve behavior that already worked.
3. Rerun the same cases after the change
Section titled “3. Rerun the same cases after the change”The coding agent changes the relevant prompt or code, records the committed source revision, and runs the same locked dataset again. From Evaluations, open the dataset to see its cases and runs, then compare the baseline and candidate.
Studio aligns outcomes by case. Inspect improvements, regressions, unchanged failures, and operational errors. Follow View spans for either attempt to check the execution behind its result. See Evaluation datasets and runs for the actual authoring, execution, and comparison commands.
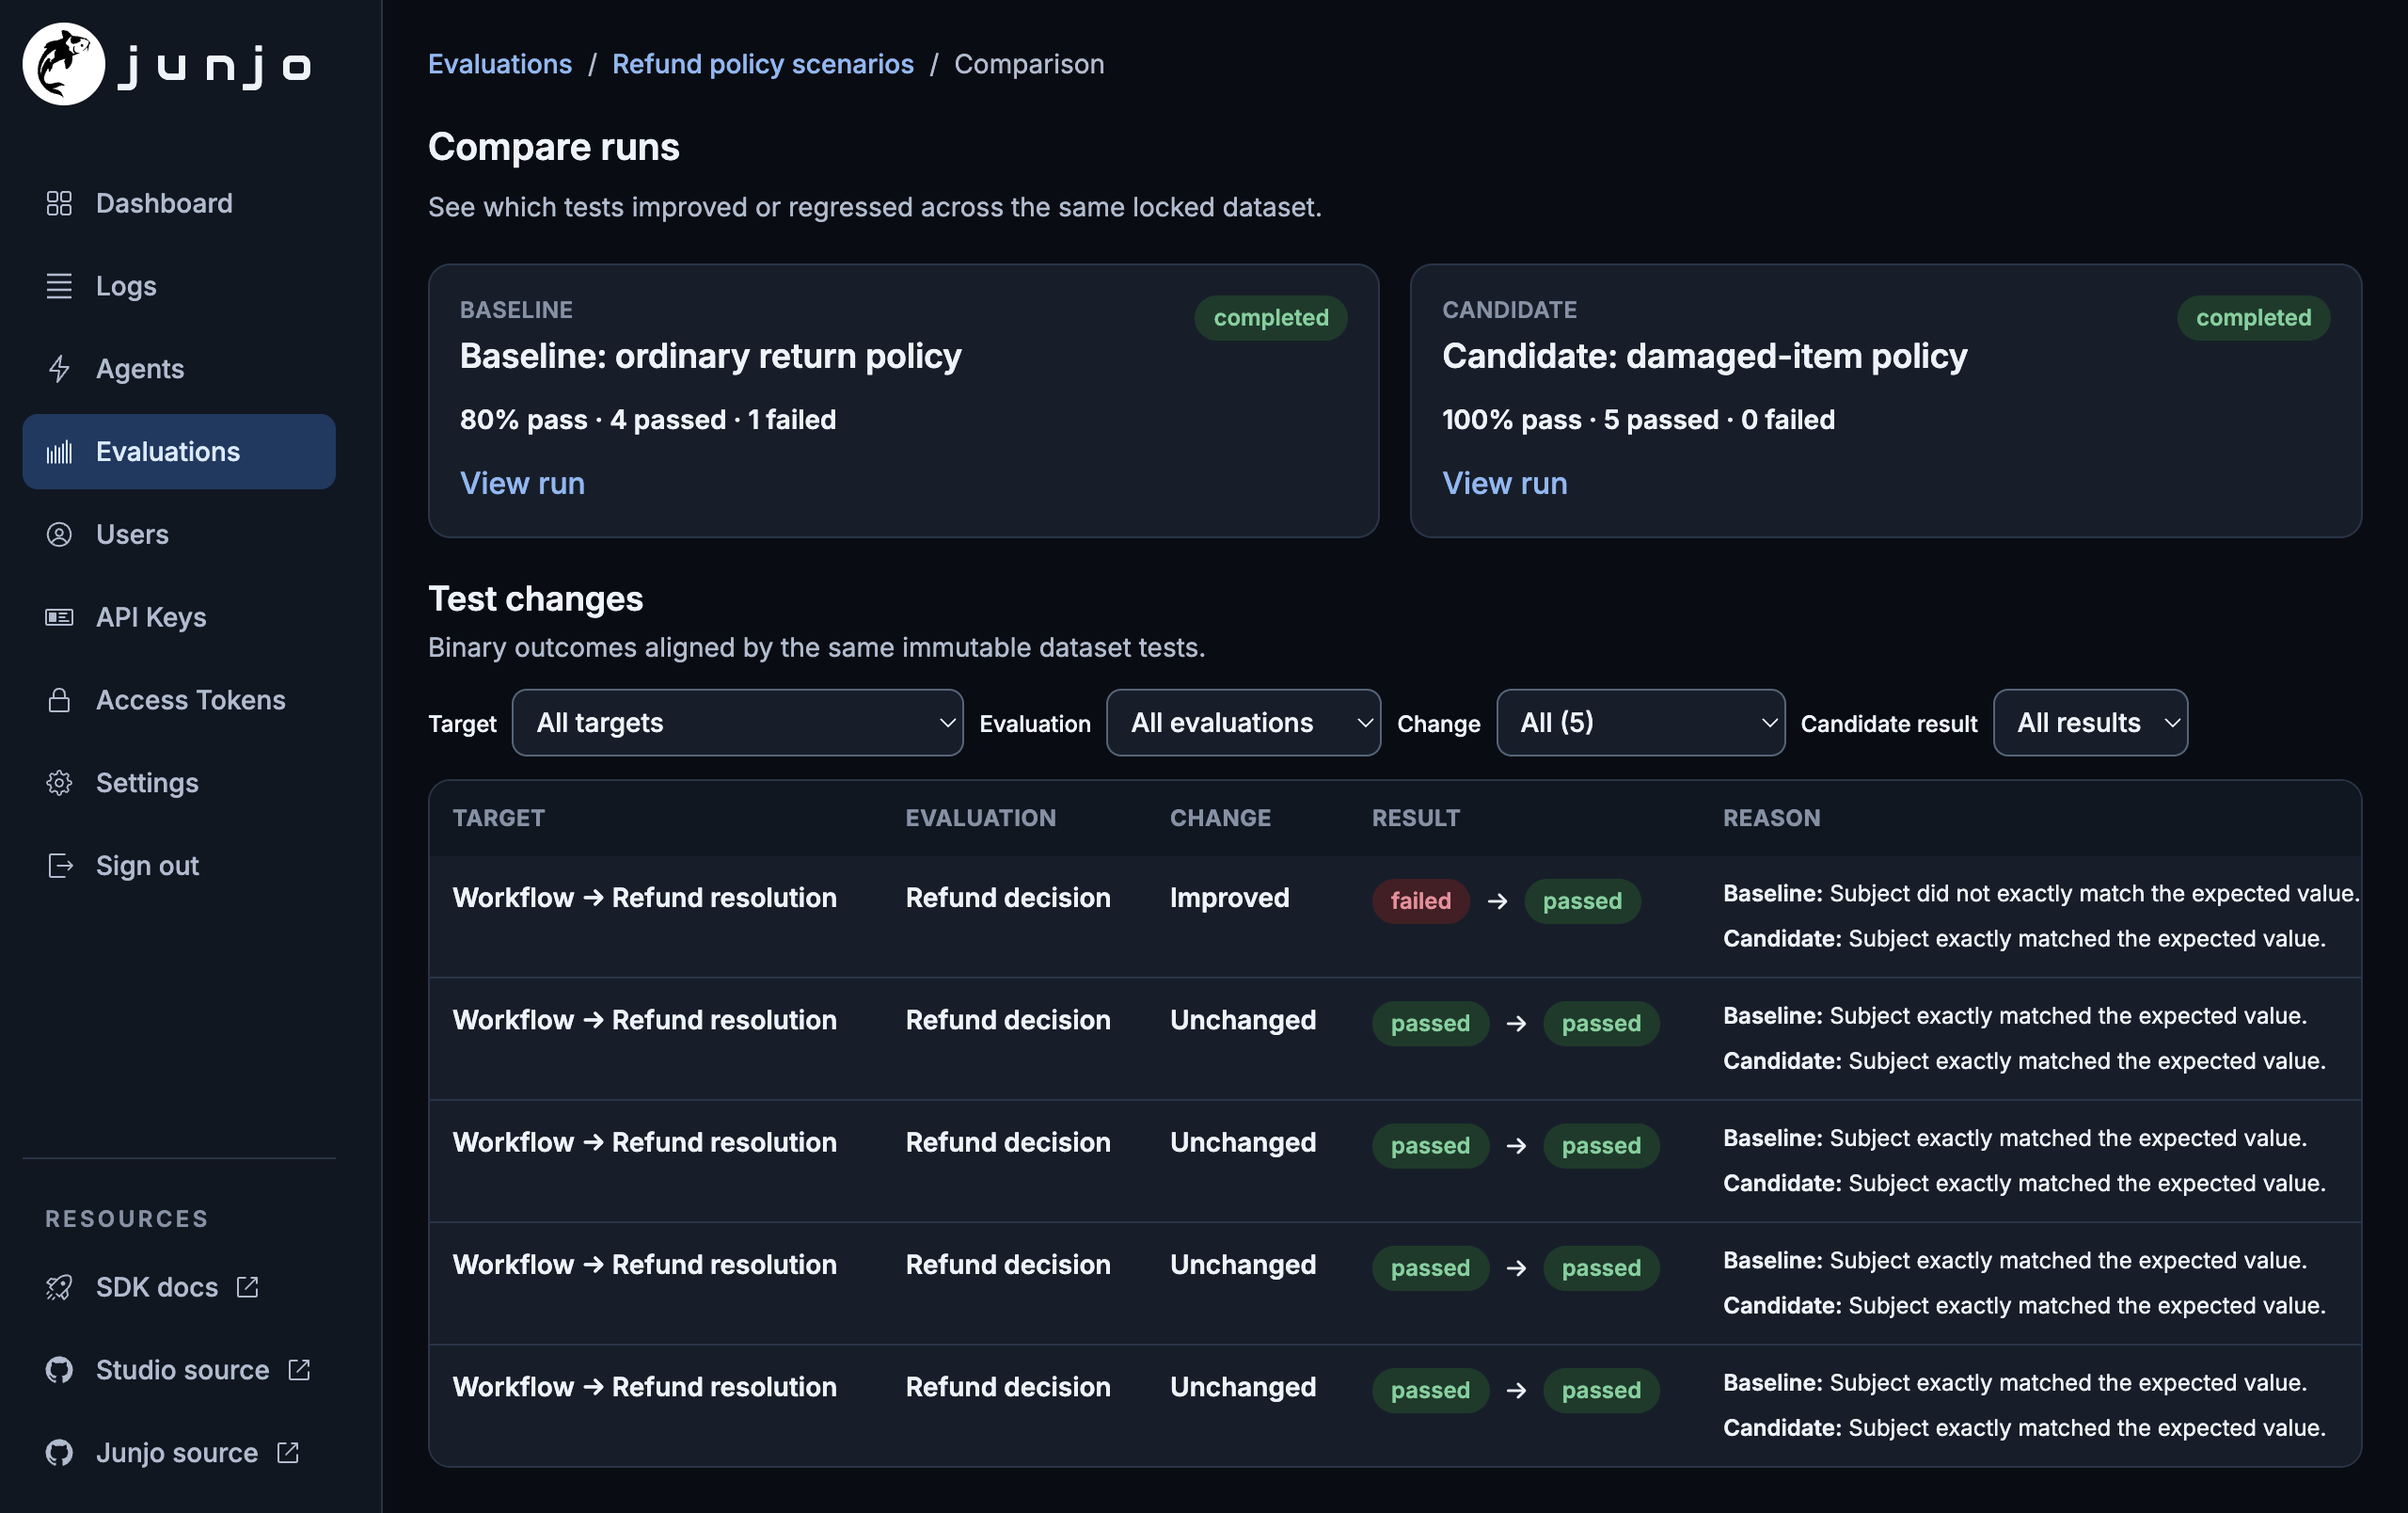
In this recorded example, the baseline passed four of five cases. Applying the damaged-item policy raised that to five of five, with no regressions or errors in this dataset. These are results from the walkthrough, not a general model quality benchmark.
4. Return a finding with evidence links
Section titled “4. Return a finding with evidence links”A useful coding-agent report includes:
- The failure and the recorded events supporting its diagnosis.
- The prompt or code change and the two source revisions tested.
- Which cases improved, regressed, failed, or errored.
- Links to the comparison and the specific executions a person should inspect.
You and your coding agent can look at the same data. The comparison establishes what happened on the tested scenarios; it does not establish correctness for every possible input.
Read the evidence at the right level
Section titled “Read the evidence at the right level”Datasets, runs, and comparisons
Section titled “Datasets, runs, and comparisons”The Evaluations view groups experiments around the datasets they share. A dataset records the ordered cases, their target, and their evaluation criteria. A run records the implementation revision and one attempt per case. The comparison view aligns two runs over the same locked dataset and can focus on a target, evaluation, transition, or candidate outcome.
Pass rate counts judged cases only: passed / (passed + failed). Review
the SDK/CLI summary’s coverage and Studio’s operational errors as well. A run
that judges fewer cases has not demonstrated an improvement just because its
pass rate increased.
The comparison is an outcome table with links into execution evidence. It is not an automatic visual diff of two entire workflow graphs or state histories.
Workflow paths and concurrent work
Section titled “Workflow paths and concurrent work”Native Junjo Workflow pages connect the declared graph to its recorded execution. Select nodes and nested Subflows to inspect the path taken, timing, and associated state evidence. Concurrent branches remain visible so you can investigate which operation contributed to a result or to wall time.
This is distinct from a static workflow diagram: the static diagram shows possible structure; Studio shows the execution evidence that arrived for a particular run.
Agent operations
Section titled “Agent operations”Native Junjo Agent pages show the realized sequence of model and Tool operations. Inspect requests and responses, Tool arguments and results, termination reason, usage, timing, and nested Agent or Workflow executions. An Agent’s dynamic operation timeline does not need a fabricated static graph.
State changes
Section titled “State changes”For native Junjo Store telemetry, inspect recorded updates and JSON patch diffs in order. Compare the available before and after state to find where facts were introduced, overwritten, or used by a later operation.
Playback inspects recorded execution history. It does not restart application processes or repeat external side effects.
Studio distinguishes verified state from incomplete evidence. A missing, redacted, excluded, or referenced payload is not an empty value. When the evidence is incomplete, retain that qualification in the diagnosis.
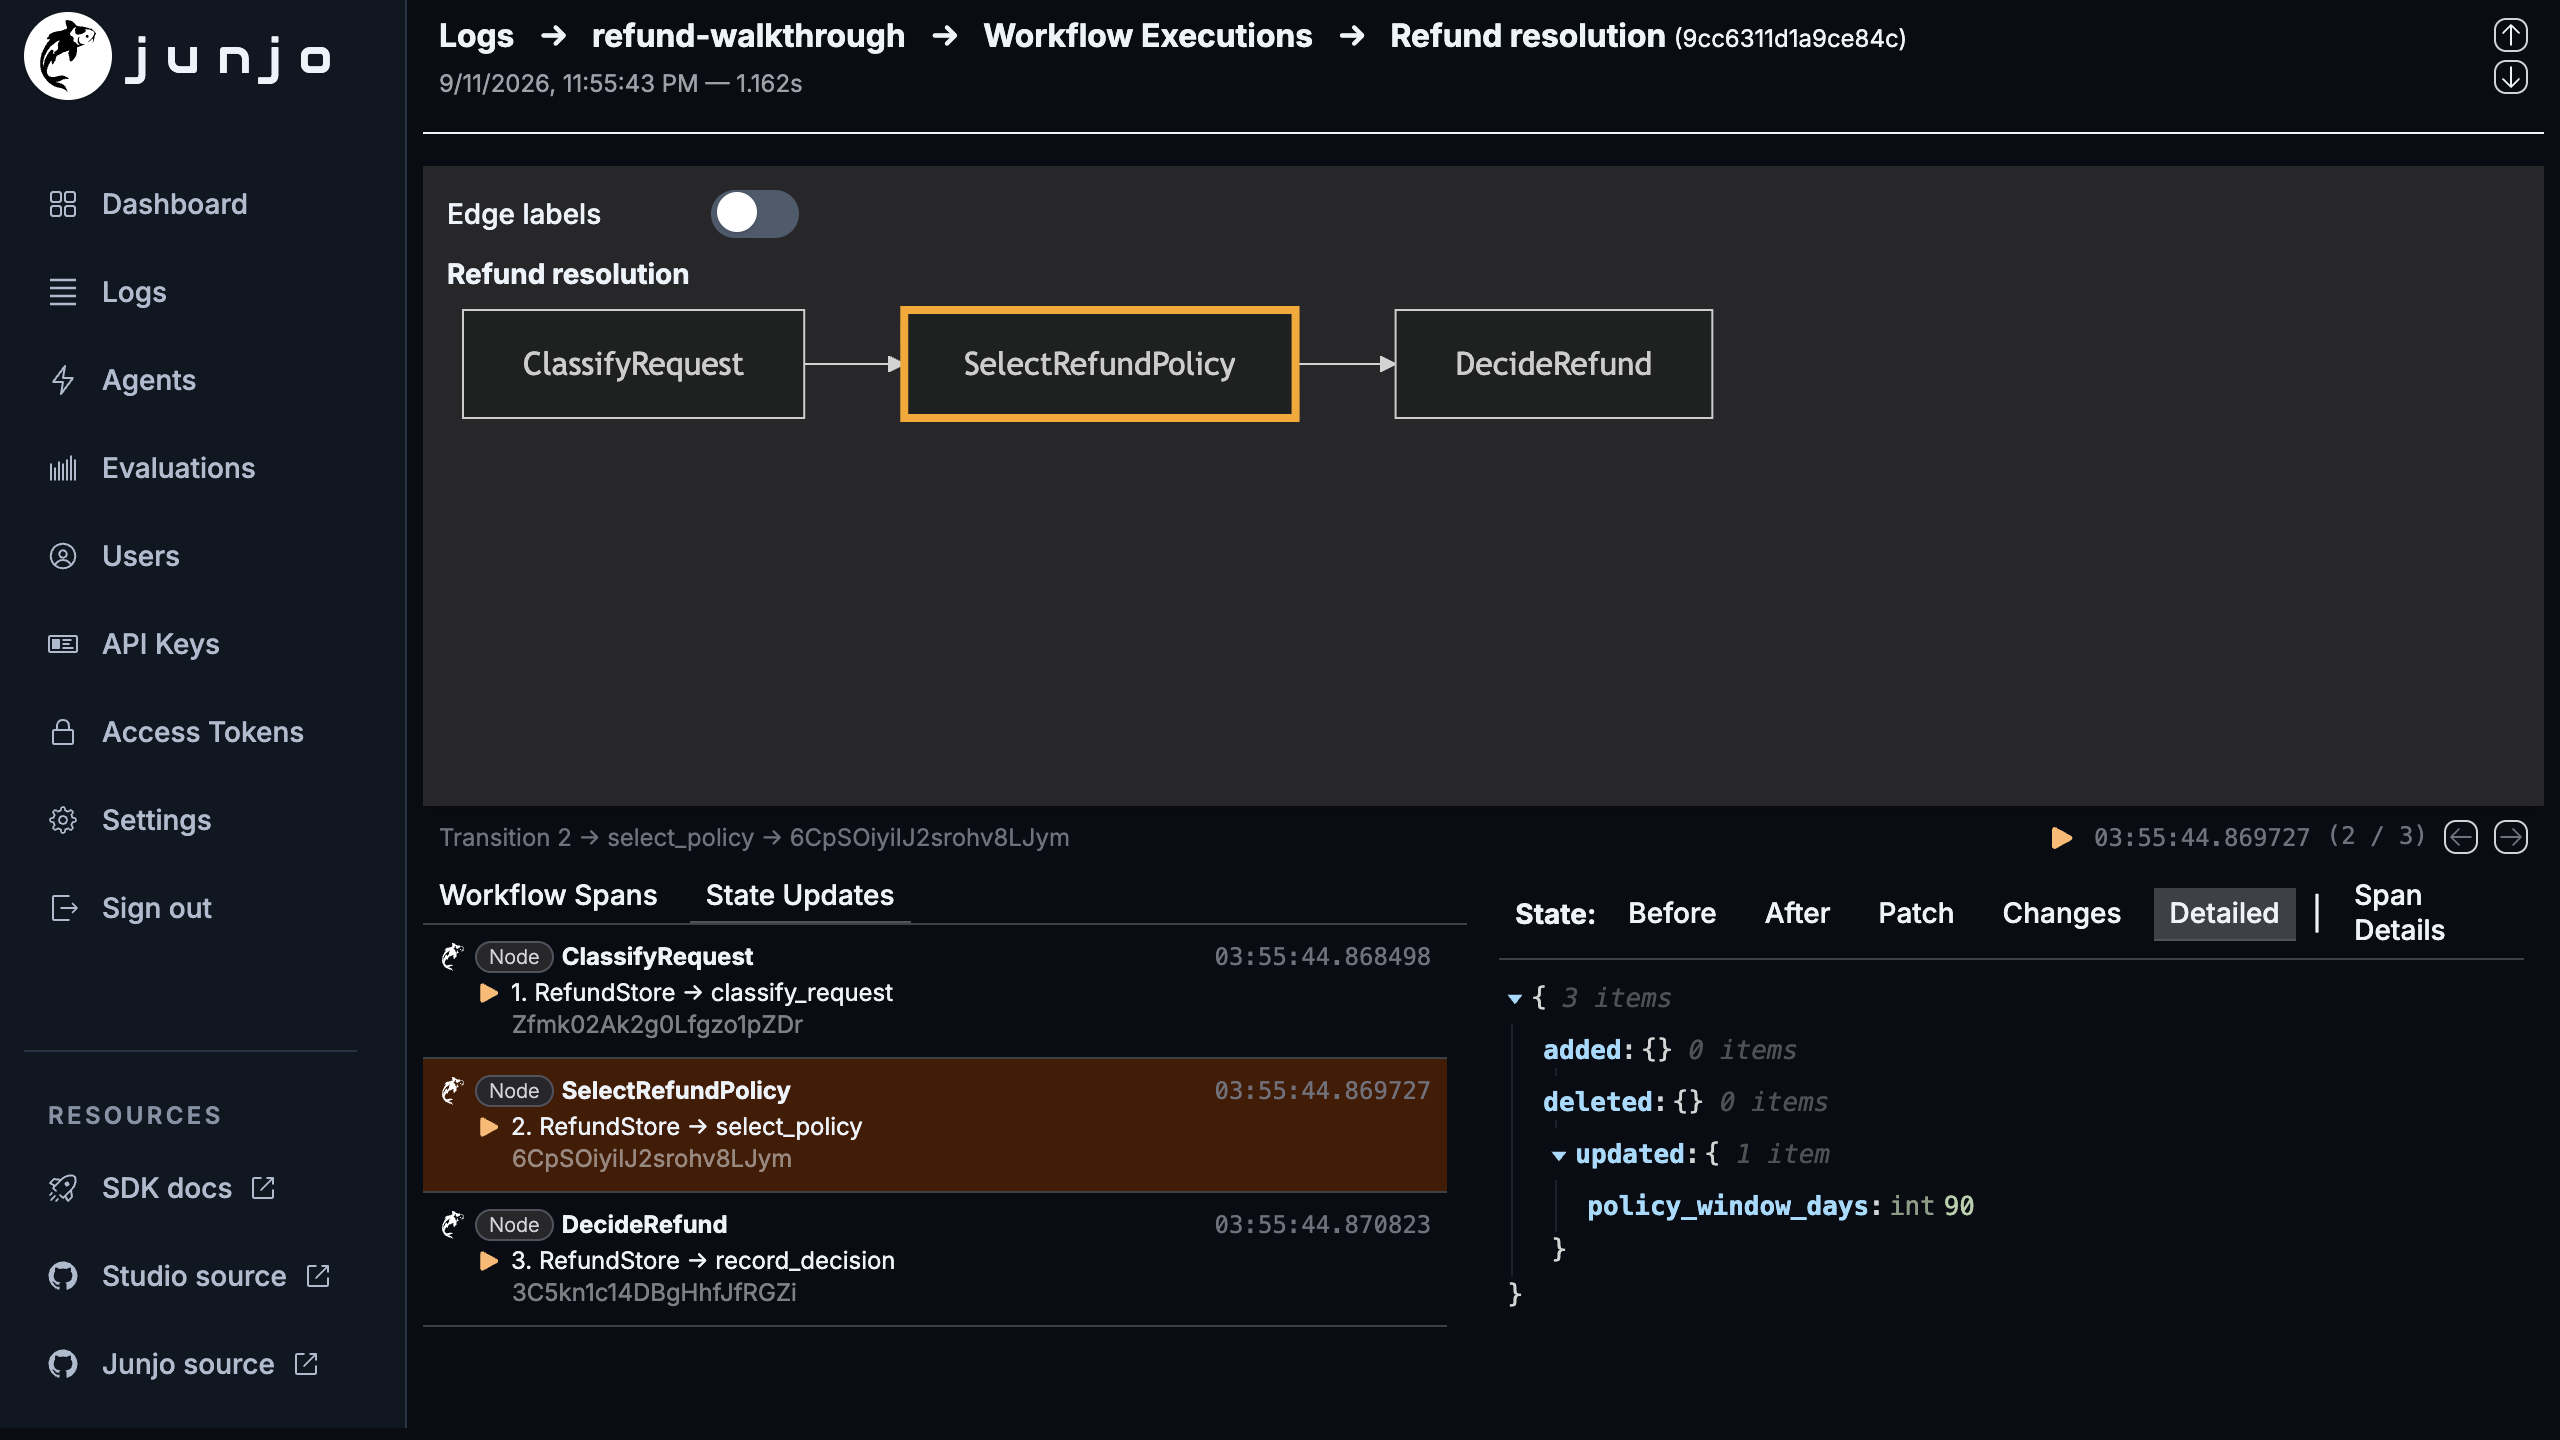
Here the model had already identified the item as damaged. The selected Store action records the corrected policy window before the final decision. The graph, update chronology, and diff explain why this execution approved the refund; the comparison shows whether the other scenarios still passed.
The complete received trace
Section titled “The complete received trace”The trace view connects parent and child spans across instrumented operations. Inspect durations, errors, attributes, and available model or Tool payloads. It also provides the shared view for external framework spans and native Junjo executions nested inside them.
The OpenAI Agents SDK integration can translate its source traces into this view while Junjo workflows or specialist agents run as its tools. External spans retain their own identity; they do not acquire native Junjo graph or Store semantics. Available payloads follow the application’s instrumentation and privacy settings.
Link an investigation to Studio
Section titled “Link an investigation to Studio”The SDK’s evidence resolution returns paths such as detail_path and
trace_path. Prefer those returned paths when producing a report. Combine
them with the Studio origin that readers open in a browser. A deployed
Studio serves the web UI from the same origin as the API the CLI uses.
For reports that link to datasets and runs directly, use these route templates with actual IDs from your Studio instance. URL-encode path segments and query values.
| Evidence | Studio web route |
|---|---|
| Dataset and its runs | /evaluation-runs/datasets/{datasetId} |
| One evaluation run | /evaluation-runs/{runId} |
| Baseline and candidate comparison | /evaluation-runs/compare?baseline_run_id={baselineId}&candidate_run_id={candidateId} |
| Exact trace and selected span | /traces/{serviceName}/{traceId}/{spanId} |
| Native Agent execution | /agents/{traceId}/{agentSpanId} |
| Native Workflow execution | /workflows/{serviceName}/{traceId}/{workflowSpanId} |
Native execution evidence can also use Studio’s /resolve/executable route
with its returned semantic identity. The resolver opens the corresponding
detail or trace view. Case evidence opens through the run’s View spans
links; individual state updates can be inspected inside an execution view.
Recipients need access to the same Studio instance. A deep link identifies the evidence; it does not make private application data public.
Installation & Setup
Section titled “Installation & Setup”Deploy Studio with the supported Docker Compose distributions. The deployment guide covers local setup, a small VM with HTTPS, persistent storage, and connecting both the application and coding agent.
Choose a deployment
Section titled “Choose a deployment”Start with the minimal distribution for local use or integration into your own Compose stack. Use the VM/Caddy distribution for the full VM and HTTPS setup. Their versioned Compose files are the source for service configuration; this guide does not maintain another copy.
Resource Requirements
Section titled “Resource Requirements”Studio is designed for small hosts, including a 1GB RAM VM. Your application and model execution can run elsewhere. See resource and storage guidance when choosing capacity for your telemetry volume and queries.
Performance and deployment sizing shows absolute throughput, latency, and completed indexing under recorded resource limits, and explains Studio’s composable services and shared-storage boundaries.
Configuration
Section titled “Configuration”Connect two distinct channels:
- Application telemetry: an API key from Studio’s API Keys page authorizes OTLP trace export to ingestion.
- Coding-agent evaluation and evidence access: a developer token from Access Tokens authorizes the SDK/CLI against the backend HTTP API.
Follow Connect your application and coding agent to verify both. Installing an exporter does not prove that a trace was stored; finish by locating the execution in Studio and reading an evaluation record.
Normal Lifecycle vs Manual Flush
Section titled “Normal Lifecycle vs Manual Flush”Your application owns its OpenTelemetry provider and closes it at the end of
its runtime. Short scripts can request a local queue drain with
TracerProvider.force_flush(), but that result does not prove collector
acceptance. Query Studio for the expected execution when remote delivery matters.
Studio accepts OTLP traces, not OTLP metrics. The application can export metrics to another destination independently.
Using with OpenInference for LLM Tracing
Section titled “Using with OpenInference for LLM Tracing”For direct model-client calls, use appropriate instrumentation in your application’s trace pipeline. Model prompts, responses, usage, and parameters appear only when the source emits them. The native model SDKs with OpenInference guide owns package installation, shared-provider initialization, capture controls, and trace verification. Its runnable junjo_openai_sdk example combines an OpenAI client with a native Junjo Agent, direct Node tool, conditional Workflow tool, and shared application Store. Use the guide’s instrumentation ownership guidance when combining this with the separate OpenAI Agents SDK tracing bridge.
Junjo-Specific Telemetry Attributes
Section titled “Junjo-Specific Telemetry Attributes”Native Junjo telemetry identifies reusable definitions, individual executions, graph structure, semantic parents, and Store evidence. Studio uses those identities to connect its specialized views to the physical trace tree.
The OpenTelemetry guide owns the public attribute and payload explanation. Use compatible SDK and Studio releases for native semantic views; receiving generic spans alone does not prove that graph or state evidence meets the active contract.
Complete Example
Section titled “Complete Example”Follow the recursive self improvement guide for the end-to-end development cycle and evaluation datasets and runs for application-local execution. Existing applications can start with the OpenAI Agents SDK integration.
Using Other OpenTelemetry Platforms
Section titled “Using Other OpenTelemetry Platforms”Junjo emits standard OpenTelemetry spans. Your application can send the same telemetry to Studio and another observability platform through its own provider configuration. Studio adds dataset/run evidence links and native Junjo execution views; adopting it does not require replacing your existing telemetry destination.
Architecture Details
Section titled “Architecture Details”The backend stores canonical evaluation and account records in SQLite, queries received telemetry, and serves the web UI that presents those records to people. Ingestion receives OTLP traces and writes the shared WAL and Parquet storage. See the Docker reference for service, credential, networking, and storage boundaries.
Troubleshooting
Section titled “Troubleshooting”No data appearing in Junjo AI Studio
Section titled “No data appearing in Junjo AI Studio”Verify the application’s actual OTLP destination and API key configuration, inspect exporter and ingestion logs, and allow for export/ingestion delay. Query the expected trace after the application closes its telemetry provider. Do not print credentials into logs while checking them.
Missing LLM data
Section titled “Missing LLM data”Verify the model/framework instrumentation and its payload policy. Missing prompts or responses may reflect intentional redaction rather than failed delivery. Generic spans cannot reconstruct unrecorded model content.
Performance issues
Section titled “Performance issues”Inspect resource usage and the active deployment profile before adjusting capacity. Sampling can remove the exact execution evidence an investigation needs, so check that policy when a targeted scenario is absent. See the Docker reference.
Docker Compose not starting
Section titled “Docker Compose not starting”Check the selected distribution’s setup, required settings, service logs, and host port conflicts. Preserve the data directory during diagnosis. The deployment guide and Docker troubleshooting provide the operator steps.