Visualize workflow graphs and execution evidence
Understanding the structure and execution flow of your explicit graph Workflows is crucial for development, debugging, and optimization.
This guide covers Junjo’s built-in Graphviz and Mermaid integrations for generating static workflow diagrams as you code, and touches upon the dynamic visualization capabilities of Junjo AI Studio.
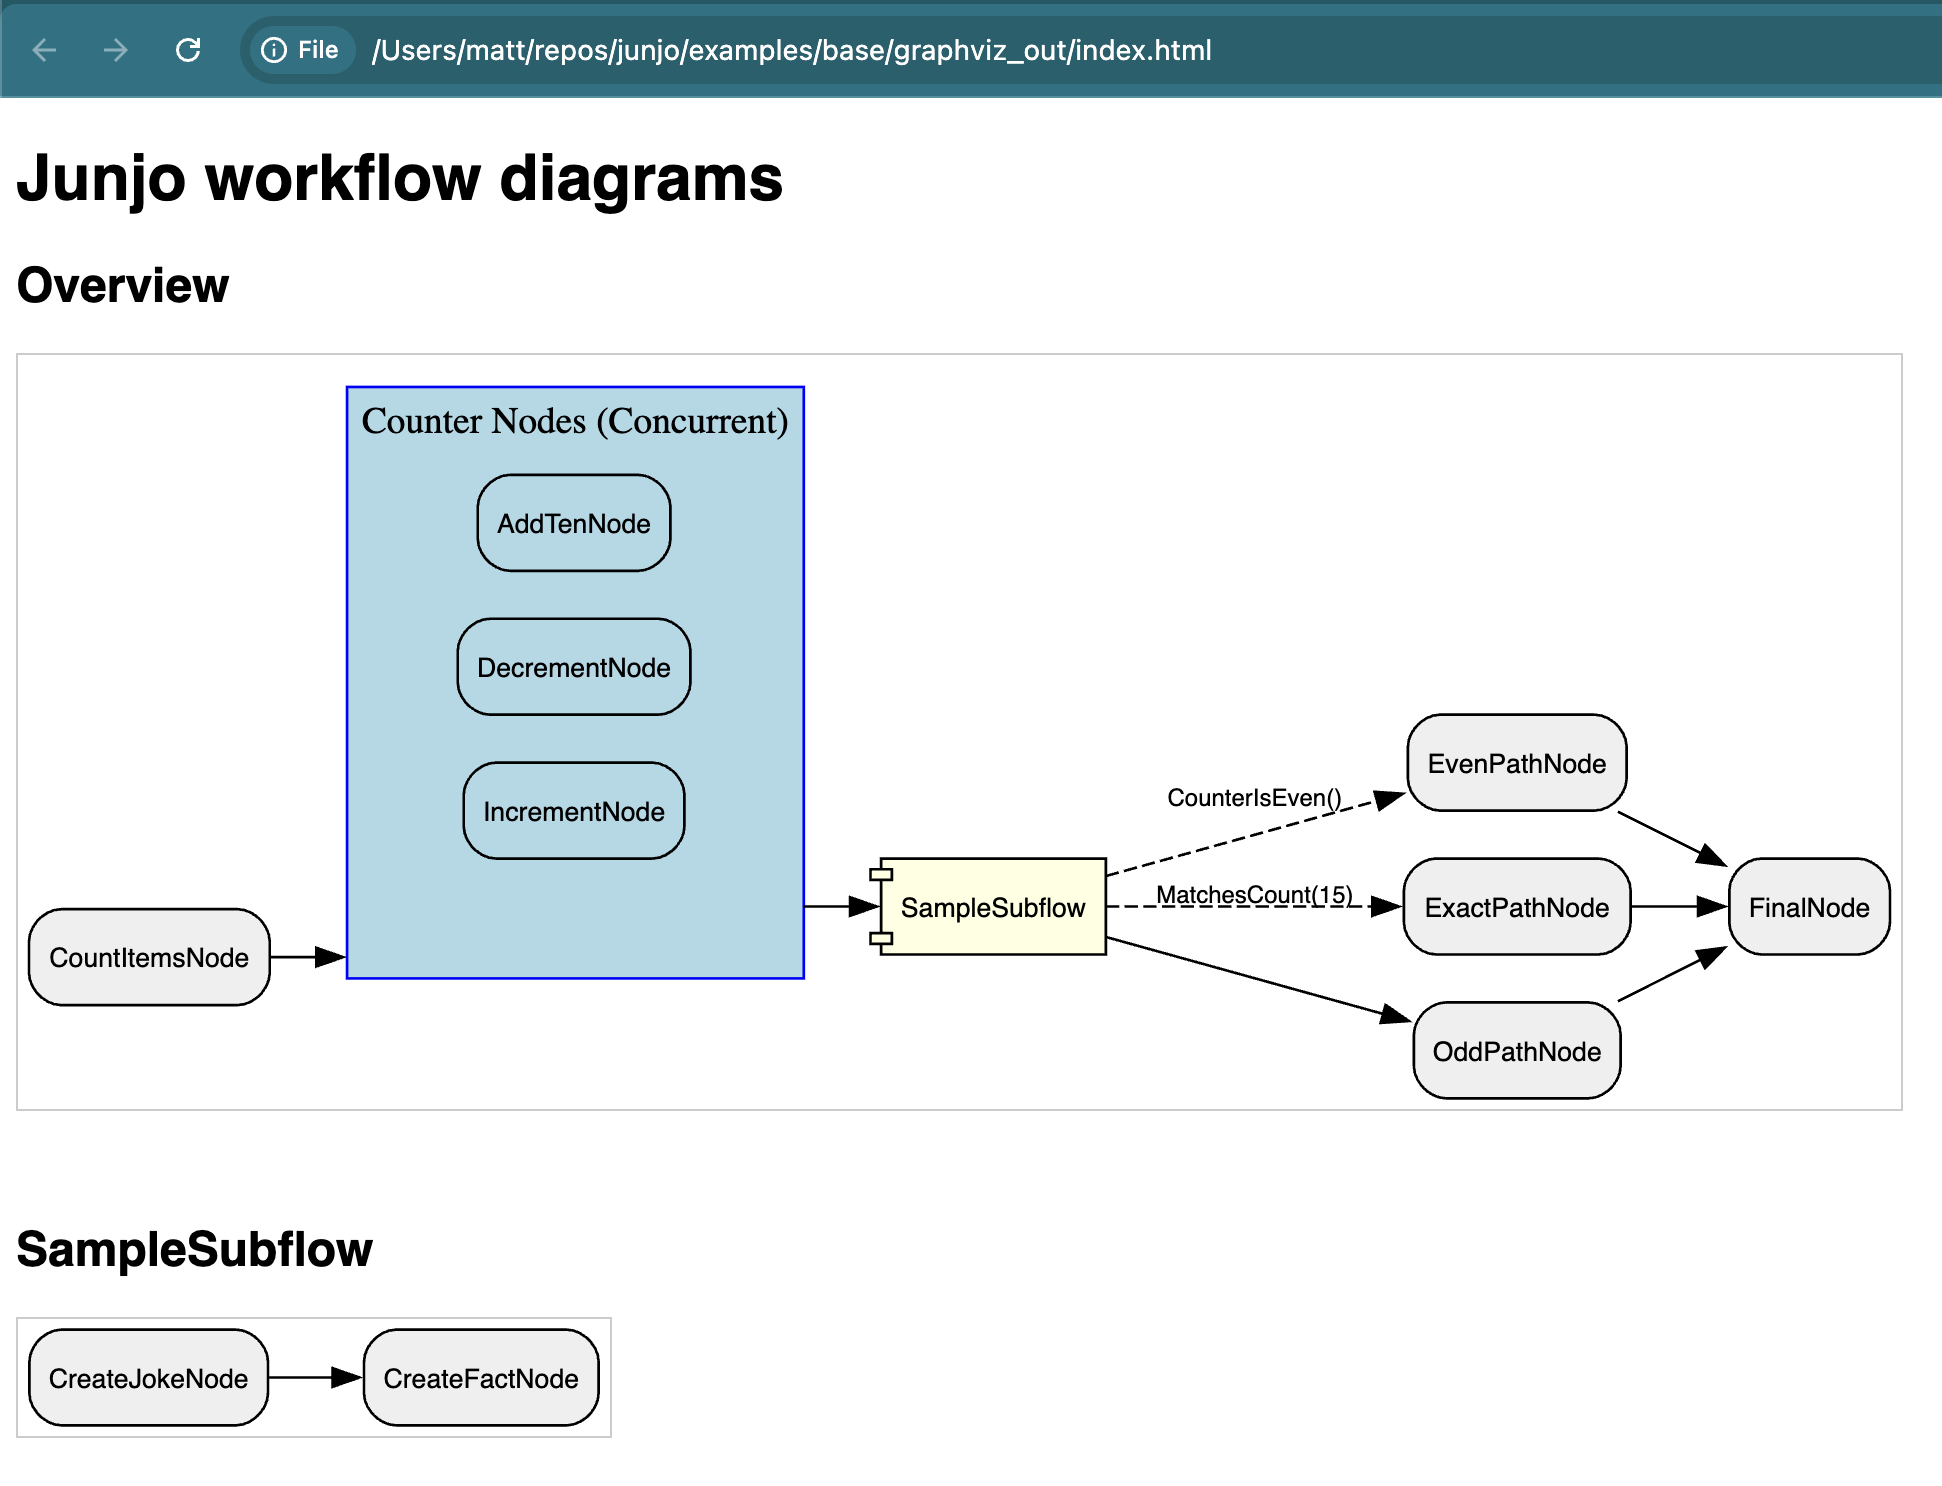
A screenshot of a basic Junjo Graph workflow rendered by Graphviz.
Why Visualize Your AI Workflows?
Section titled “Why Visualize Your AI Workflows?”Complex AI systems, especially those involving multiple Large Language Model (LLM) calls, conditional logic, and concurrent operations, can quickly become black boxes. Visualization helps to:
- Increase Development Speed: Quickly understand the structure of complex workflows, and how code changes affect the overall system.
- Collaborate with Non-Developers: Share visual representations with stakeholders who may not be familiar with the codebase, making it easier to discuss changes and improvements.
- Enhance Documentation: Provide clear diagrams that can be included in documentation, making it easier for new developers to understand the system.
- Clarify Architecture: See the explicit connections, dependencies, and potential paths of execution within your graph.
- Aid Debugging: Quickly identify unexpected pathways, bottlenecks, or errors in graph logic.
- Facilitate Collaboration: Share clear diagrams with team members to ensure everyone understands the workflow.
- Improve Onboarding: New developers can grasp the system’s design much faster.
- Support Eval-Driven Development: Visual feedback complements testing by showing how data and control flow through the system during different evaluation scenarios.
- Analyze Model-Assisted Paths: When model output updates state used by an edge condition, compare the path a run took with the graph’s declared possible paths. The model does not dynamically rewrite the Workflow graph.
Generating Workflow Diagrams with Graphviz
Section titled “Generating Workflow Diagrams with Graphviz”Junjo can directly render your workflow graphs as images using Graphviz.
Generate detailed diagrams of your main workflow and any nested subflows,
including how RunConcurrent nodes are structured.
Prerequisites
Section titled “Prerequisites”-
Graphviz System Installation: Graphviz must be installed on the system where you’re generating rendered image assets (for example, your development machine or a Docker container running
Graph.export_graphviz_assets()).For macOS with Homebrew:
Terminal window brew install graphvizFor other systems, please refer to the official Graphviz download page.
-
Junjo Installation: Install Junjo in the environment where you want to generate workflow diagrams.
Terminal window # With pippip install junjo# With uvuv add junjo
Generating Assets
Section titled “Generating Assets”The Graph object in Junjo provides an export_graphviz_assets() method. This function will:
- Generate
.dotnotation files for your main graph and each subflow. - Render these
.dotfiles into image files. The default image format is SVG. - Create an HTML page (
index.html) that displays all generated diagrams with appropriate headings.
Junjo’s Graphviz renderer works directly from the compiled graph snapshot
produced by Graph.compile(). That keeps diagram generation aligned with
the same graph structure Junjo uses for validation and traversal.
export_graphviz_assets() accepts a few practical options:
out_dir: where generated files are written. Defaults tographviz_out.fmt: the Graphviz output format. Defaults tosvg.dot_cmd: the Graphviz executable. Defaults todot.open_html: whenTrue, opens the generatedindex.htmlin your default browser.clean: whenTrue, removes old.dotfiles and old rendered files matchingfmtfrom the output directory before writing new assets.
If Graphviz is not installed, or if the dot command fails, Junjo raises
GraphRenderError with the failing asset name and command failure details.
Example Usage
Section titled “Example Usage”Let’s assume you have a workflow graph factory defined, for instance, create_sample_workflow_graph from one of the Junjo examples.
In this example, we create and execute a visualize.py script to generate the Graphviz rendered assets.
# Import the graph factory you want to visualizefrom base.sample_workflow.graph import create_sample_workflow_graph
def main():    # Generate .dot files, rendered SVG files, and graphviz_out/index.html.    create_sample_workflow_graph().export_graphviz_assets(open_html=True)
if __name__ == "__main__":    main()
Running the script (for example, python visualize.py) will create a
directory named graphviz_out containing the rendered assets. With
open_html=True, Junjo also opens graphviz_out/index.html in your
default browser.
Visual Elements:
- Nodes: Represent individual processing units (your Python functions wrapped in Junjo
Nodeobjects). - Edges: Show the directed flow and conditions between nodes. Conditional edges are typically styled differently (e.g., dashed lines with labels).
- Clusters (for RunConcurrent):
RunConcurrentnodes are rendered as distinct clusters, visually grouping the concurrently executing nodes. - Subflows: Subflows are initially shown as a single “component” shape in the overview graph. A separate diagram is generated for each subflow, detailing its internal structure. This allows for a clean, hierarchical drill-down approach to understanding complex workflows.
Generating Mermaid Flowcharts
Section titled “Generating Mermaid Flowcharts”Junjo also supports Mermaid flowchart generation directly from the compiled
graph snapshot produced by Graph.compile().
Like the Graphviz renderer, Mermaid rendering uses the same canonical structural representation as validation and traversal rather than routing through the serialized execution graph snapshot. That keeps Mermaid output stable across repeated fresh graph builds with the same topology.
The Graph.to_mermaid() method returns Mermaid flowchart syntax with:
- Structural node identifiers: Stable identifiers derived from graph shape instead of runtime object IDs.
- Concurrent groups as Mermaid subgraphs:
RunConcurrentitems stay visually grouped. - Subflow overview and detail sections: Subflows appear as subroutine nodes in the overview graph and as disconnected detail subgraphs lower in the Mermaid document.
Example Usage
Section titled “Example Usage”from pathlib import Path
from base.sample_workflow.graph import create_sample_workflow_graph
def main() -> None: graph = create_sample_workflow_graph() mermaid = graph.to_mermaid() Path("workflow.mmd").write_text(mermaid, encoding="utf-8")
if __name__ == "__main__": main()You can paste the generated Mermaid text into tools that support Mermaid
flowcharts, or commit the .mmd file alongside your documentation for
lightweight graph review in pull requests and design discussions.
Dynamic Telemetry with Junjo AI Studio
Section titled “Dynamic Telemetry with Junjo AI Studio”For investigation of recorded executions, the separately deployed Junjo AI Studio ingests your application’s OpenTelemetry spans and provides a web interface to:
- Inspect recorded execution graphs: See the path taken by a specific execution after its spans arrive.
- Step through state changes: Observe how the redux-inspired state machine is updated by each node.
- Inspect inputs and outputs: Understand the data flowing through your workflow at each step.
Junjo batches finished spans; this is not a live debugger that pauses or steps the running application. State stepping replays received state evidence. A coding agent can query the same records and return Studio links for you to inspect its diagnosis.
While Graphviz and Mermaid provide static “blueprints” of your workflow’s potential paths, Junjo AI Studio offers a dynamic view of actual executions, making it an invaluable tool for debugging and fine-tuning your AI applications.
By combining static Graphviz or Mermaid diagrams for architectural understanding with dynamic Junjo AI Studio telemetry for execution analysis, developers can build, test, and maintain complex AI workflows with greater confidence and clarity.
Next Steps:
- Explore the Getting Started guide for installation and basic usage.
- Dive into the Api reference for detailed information on Junjo’s components.
- Use evaluation datasets and runs to compare changed outcomes with their execution evidence.
- Follow recursive self improvement to turn that evidence into a measured application change.
- Set up Junjo Ai Studio for dynamic telemetry visualization.